Blog
How Much Do H-1B Workers Really Earn? A State-by-State Salary Map
July 1, 2026
There's no single H-1B salary. Using Software Developers as a worked example, we map how the same job pays $40K+ more in one state than another — and why location, level, and timing move the number.
"How much do H-1B workers earn?" is the most common question we get — and the honest answer is that there is no single number. The wage on a Labor Condition Application (LCA) depends heavily on three things: what the job is, what state it's in, and what seniority level it's filed at. Change any one of those and the figure can swing by tens of thousands of dollars.
This article makes that concrete. Using Software Developers (SOC code 15-1252) — the single most common H-1B occupation — as a worked example, we map how the same job title pays very differently across states, explain why, and show the two other levers (seniority level and year) that move the number just as much. By the end you'll know how to read any wage figure you see rather than treating it as "the" H-1B salary.
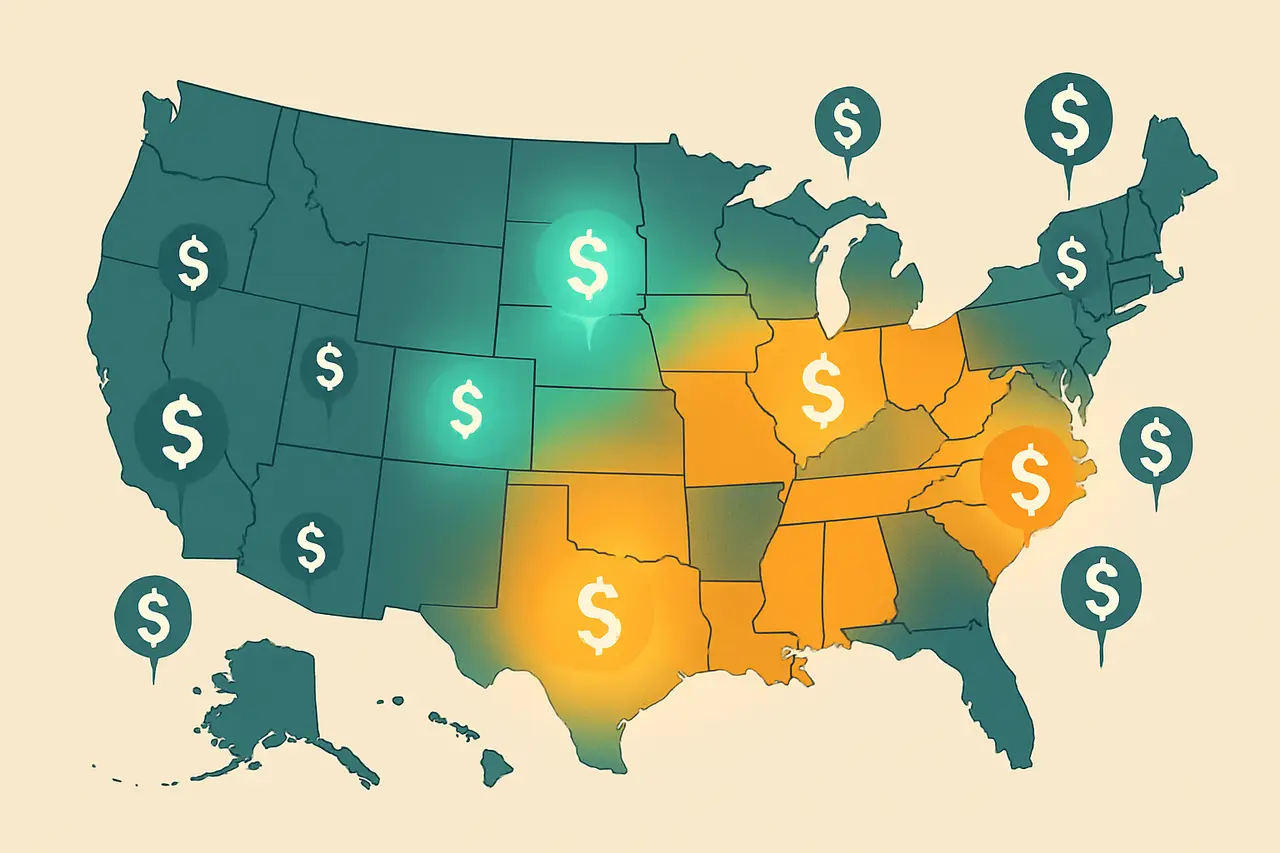
The same job, a ~40% pay gap by state
Here is the median filed wage for Software Developers in ten of the largest hiring states. These are all-years medians drawn from LCA disclosures, so they're directly comparable to each other:
| State | Median filed wage (Software Developers) |
|---|---|
| Washington | $135,000 |
| California | $130,000 |
| New York | $110,460 |
| North Carolina | $101,109 |
| Massachusetts | $101,010 |
| New Jersey | $100,000 |
| Texas | $98,910 |
| Virginia | $97,600 |
| Georgia | $94,203 |
| Illinois | $90,500 |
Read the top and bottom of that list together: a software developer in Washington ($135,000) is filed at roughly $44,500 more than one in Illinois ($90,500) — a gap of nearly 40% for the identical Software Developers occupation code. This isn't a difference in job duties. It's geography.
High demand does not mean high pay
The most useful thing this map reveals is that the states that hire the most software developers are not the states that pay the most.
Texas is one of the largest states by software-developer filing volume — hundreds of thousands of applications — yet it sits near the bottom of the top ten on wage, at $98,910. Washington, which files far fewer, tops the list at $135,000. If you assumed "more jobs there = better pay there," the data says the opposite.
Why? A few reasons stack up:
- The employers filing there are different. States dominated by large IT-services and consulting firms (which file enormous volumes of mid-level roles) tend to show lower medians than states anchored by a handful of high-paying product companies.
- Cost of living and local labor markets. The prevailing-wage system ties minimums to local wage surveys, so an expensive metro pulls the whole distribution up.
- Role mix inside the SOC code. "Software Developers" spans everyone from a junior maintenance engineer to a senior systems architect. States with more senior work show higher medians even at the same code.
The lesson for anyone weighing an offer: don't benchmark a salary against a national average. Benchmark it against the same role in the state where the job actually is. You can do that on any occupation or state page.
The coastal premium is real — and measurable
Group the states and a clear pattern emerges. The Pacific coast leads (Washington and California both cluster around $130,000–$135,000), the Northeast corridor sits in the middle (New York around $110,000; Massachusetts and New Jersey around $100,000), and large interior and Southern hubs trail (Texas, Georgia, and Illinois in the low-to-mid $90,000s).
That's roughly a $35,000–$45,000 coastal premium for the exact same SOC code. It's one of the cleanest illustrations in the data that where you work drives the number as much as what you do. For a broader view of which states carry the most H-1B activity overall, see the top H-1B states ranking.
Level: the second big lever
Geography is one axis. Seniority is the other. Every LCA is filed at a prevailing-wage level from I (entry) to IV (fully competent/senior), and the jump between levels is large. Nationally, Software Developer filings ladder up like this:
| Wage level | Typical filed wage |
|---|---|
| Level I (entry) | $88,442 |
| Level II | $102,500 |
| Level III | $130,000 |
| Level IV (senior) | $155,000 |
That's a $66,500 spread from Level I to Level IV — even wider than the state gap. Now combine the two levers. A Level I developer in Illinois and a Level IV developer in Washington are both "H-1B software developers," but they occupy completely different pay worlds. When you read a single headline salary, always ask: which level, and which state? Those two questions explain most of the variation before you get to the employer's name.
Wages have surged over time — pick a consistent year
There's a third lever that quietly reshapes the whole conversation: time. The median filed wage for Software Developers has risen dramatically over the life of the program — from roughly $80,000 in the early 2010s toward the mid-$140,000s in the most recent filing year. That's close to a doubling.
This matters for how you read any number, including the map above. A recent single-year median will look much higher than an all-years median because it reflects both wage inflation and a shift toward more senior filings. The state figures in this article are all-years medians, chosen so they're comparable to one another. If you look at a live occupation page and see a higher current-year headline, that's not a contradiction — it's a different time window. The rule of thumb: only compare numbers computed on the same basis (same years, ideally same level).
The map changes by profession
None of this is unique to software developers — but the shape of the map differs by job. High-paying technical and medical occupations tend to have steeper coastal premiums, while some roles are more geographically even. That's why the site keeps wage-by-state data on each occupation page rather than publishing one blended "state salary." A Data Scientist, a Financial and Investment Analyst, and a physician will each have their own geography of pay.
To see which occupations sit at the top of the wage scale before you drill into geography, this ranking is a good starting point:
The takeaway: "highest-paying job" and "highest-paying place for that job" are two separate questions, and you need both to make sense of an offer.
How to read any H-1B wage number
Put it all together and you have a simple checklist for interpreting any filed wage:
- What occupation (SOC code)? A single title can hide a wide range of roles.
- What state or metro? Expect a $35K+ swing on the same code between coastal and interior hubs.
- What wage level (I–IV)? The entry-to-senior spread can exceed the state spread.
- What year? Medians have climbed steeply; only compare like years.
Takeaway
There is no such thing as "the" H-1B salary. For Software Developers alone, the same occupation code ranges from about $90,500 in Illinois to $135,000 in Washington — and layering in seniority level and filing year widens the picture further. The most demand-heavy states aren't the best-paying ones, and the coastal premium is large and consistent. Before you compare your number to anyone else's, match the occupation, the state, the level, and the year. Use the per-occupation and per-state pages to benchmark the exact role you care about — that's where the real answer lives.
h1b.report is an independent project and is not affiliated with the U.S. Department of Labor or USCIS. Figures come from public LCA disclosure data; see our methodology for how they're computed.
- wages
- state analysis
- software developers
- salary data
- H-1B basics